


Hedera Hashgraph’s native cryptocurrency, HBAR, tested the critical $0.10 support level amid growing investor interest, as exchange-traded funds (ETFs) associated with the token reached a two-month trading record. This renewed activity highlights a cautious yet optimistic market response following recent developments in the cryptocurrency sector, signaling potential shifts in HBAR’s short-term price dynamics.
HBAR Approaches Ten Cent Support Amid Rising Market Activity
The HBAR token has demonstrated notable resilience, maintaining a critical support level around the $0.10 mark even as trading volumes surge. This firm floor is seen as a positive technical indicator by traders, suggesting that investor confidence in the asset remains intact despite broader market fluctuations. The increased activity is driven largely by a fresh wave of market participants capitalizing on Hedera Hashgraph’s unique positioning and upcoming project announcements.


Concurrently, the market is witnessing a significant uptick in ETF inflows, reaching a two-month high that has contributed to heightened volatility and liquidity. Key factors influencing this momentum include:

- Increased institutional interest in blockchain-related ETFs
- Renewed speculative trading around upcoming Hedera network upgrades
- Macro-economic stability encouraging risk-on investment behavior
| Metric | Current Value | Change (7d) |
|---|---|---|
| HBAR Price | $0.10 | +2.5% |
| ETF Trading Volume | 25M Shares | +18% |
| Market Activity Index | 72 | +10 Points |

ETFs Reach Two Month High Impacting HBAR Price Dynamics
The recent surge in exchange-traded funds (ETFs) to a two-month high has introduced notable volatility to the HBAR market. Investors are closely observing how this inflow of capital influences Hedera Hashgraph’s token price, particularly as HBAR tests the crucial $0.10 support level. The increased trading volumes tied to the ETF record reflect a broader enthusiasm within institutional and retail sectors that could drive both upward momentum and potential sell-offs depending on market sentiment.
Key factors contributing to the current price dynamics include:
- ETF inflows: Larger capital movement into blockchain-related ETFs boosts liquidity but also intensifies price swings.
- Market sentiment: Mixed reactions among investors regarding the sustainability of HBAR’s price floor.
- Technical resistance: $0.10 marks a psychological and technical threshold influencing trader strategies.
| Metric | Current Value | 2-Month Change |
|---|---|---|
| ETF Volume | 12.4M Shares | +25% |
| HBAR Price | $0.102 | +3.5% |
| Trading Volume | 8.9M Tokens | +40% |

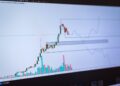
Technical Indicators Suggest Possible Consolidation Phase
Technical charts for HBAR reveal patterns indicative of a potential consolidation phase near the critical $0.10 support level. Traders closely watch the Relative Strength Index (RSI) which has hovered steadily around the 50-mark, suggesting neither strong buying nor selling momentum. Meanwhile, the Moving Average Convergence Divergence (MACD) is showing signs of flattening out after a brief bullish crossover, reinforcing the possibility of sideways price movement as market participants assimilate recent gains.
Additional signals include the Bollinger Bands narrowing, reflecting diminishing volatility and a tighter trading range. Key factors currently influencing this phase include:
- Volume trends: A moderate drop in trading volume, signaling decreased trader activity.
- Support test: Repeated successful defenses of the $0.10 floor without significant breakdowns.
- Moving averages: Short-term averages converging with longer-term averages, indicating equilibrium.
| Indicator | Current Reading | Implication |
|---|---|---|
| RSI | 49.5 | Neutral Momentum |
| MACD | Flattening | Consolidation Signal |
| Bollinger Bands | Contracting | Lower Volatility |

Investors Advised to Monitor ETF Trends for Strategic Entry Points
Market participants are closely observing recent movements as HBAR hovers near the pivotal $0.10 support level. This threshold is significant, as it reflects investor confidence amidst the backdrop of Exchange-Traded Funds (ETF) activity reaching a two-month peak. The resurgence in ETF inflows suggests increased willingness of institutional players to engage, potentially foreshadowing enhanced liquidity and price stabilization for HBAR.
Strategic entry points can be identified by tracking ETF trends intertwined with HBAR’s price dynamics. Key indicators to watch include:
- ETF volume spikes: Sudden surges often indicate growing market interest.
- Fund inflow consistency: Sustained investment flows hint at foundational support.
- Volatility measures: Diminishing price swings could identify consolidation phases.
Below is a comparison of HBAR close prices aligned with ETF volume trends over recent weeks:
| Week | HBAR Close ($) | ETF Volume (Millions) |
|---|---|---|
| Week 1 | 0.095 | 12.5 |
| Week 2 | 0.102 | 14.8 |
| Week 3 | 0.098 | 18.4 |
| Week 4 | 0.101 | 20.3 |
Insights and Conclusions
As HBAR continues to test the $0.10 support level amid renewed investor interest, the cryptocurrency market remains closely watchful of further developments. The recent surge in ETF activity, reaching a two-month high, underscores growing institutional engagement that could influence HBAR’s price trajectory in the near term. Market participants will likely monitor these dynamics carefully to gauge whether the current momentum can be sustained.


